Today, 94% of enterprises use a cloud service in some capacity, and by 2020, 83% of entire enterprise workloads will be stored in the cloud.
For MSPs, this presents a huge challenge: The network—and a strong internet connection—is now your clients’ lifeline to everything their employees use and need to get things done. 100% uptime is now more than an expectation—it’s mandatory.
And in order to effectively take care of your client networks, keep them connected, and keep them secure, you need to know two things:
- How the network is performing
- How the network is being used
Auvik has always been great at showing you the first. With real-time network mapping, inventory updates, and customizable alerts, you’ll have an accurate picture of the network and you’ll know when something’s wrong.
With the launch of TrafficInsights earlier this year, we’re now also great at showing you the second. TrafficInsights helps you see what’s travelling through the network so you can spot irregularities and ensure the network is being used properly.
What is Auvik TrafficInsights?
TrafficInsights is Auvik’s NetFlow feature for MSPs. Using machine learning, TrafficInsights complements NetFlow data with additional metadata—like source and destination geography—so you can really understand the traffic, even if it’s encrypted.
With TrafficInsights, if any traffic flows through a flow-enabled network device, you can see who’s on the network, what they’re doing, and where their traffic is going.
So let’s investigate some common network cases you or your techs face day to day—and how TrafficInsights can help:
Case #1: You get an alert that the network is at peak utilization
Before TrafficInsights, identifying the reason why your client’s internet bandwidth was maxed out was a guessing game.
You knew how much bandwidth was being used, but you didn’t know what the traffic was or if it was legitimate.
In TrafficInsights, however, all traffic reports are broken down by application group and application. The Application view lets you choose the different groups of applications or choose specific applications you want to see.
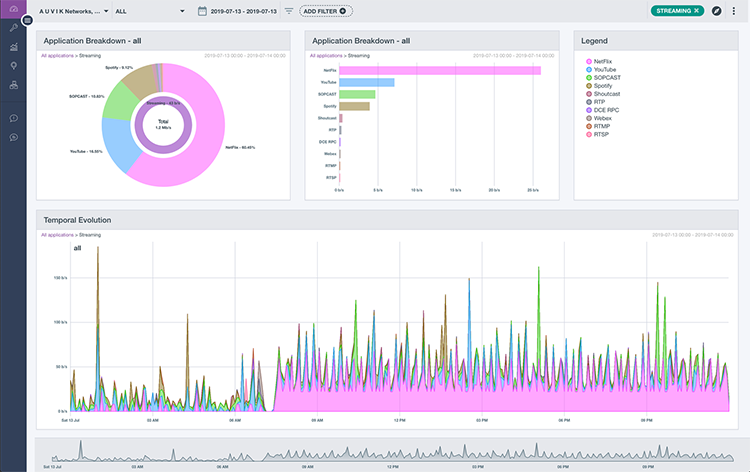
Application view – Auvik TrafficInsights
That means you’re able to determine if the traffic is legitimate, or if it’s someone streaming The Office (which is what’s likely happening in the screenshot above). If bandwidth is being spent on a personal app, you can drop into the endpoint causing the spike and shut it down or work with the end user to stop it.
And if the network is reaching peak utilization because of legitimate business traffic, then you can make the case for your client to invest in a better internet connection. It’s a capacity planning dream come true.
Case #2: The client says the network grinds to a halt at noon
Network performance issues can arise at the most inconvenient times—like when you’re driving to pick up lunch at noon.
Since most tools require you to catch the issue in real-time, that means you’d be skipping lunch… again.
That’s not the case with TrafficInsights. Since TrafficInsights stores flow data for 30 days, you don’t have to hop on your computer immediately—you can go back in time to investigate an issue.
Using the time interval selector at the bottom of the TrafficInsights dashboard, you can select a specific time frame within a specified date range—like Tuesday from noon to 1 p.m., for example.
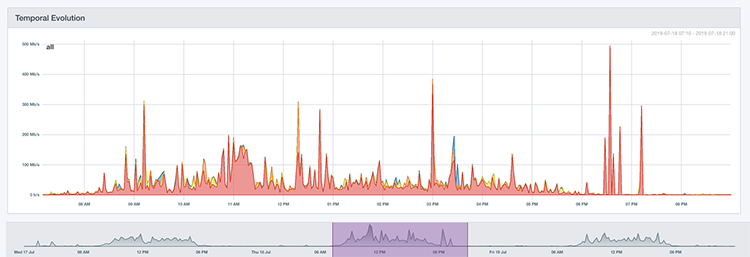
Auvik TrafficInsights: You can specify a data range when viewing network traffic
Your time frame selection is maintained as you switch dashboard panels, you’re able to dive into IP details and application usage as part of your investigation.
Using the Top Talkers view, you can see exactly which device is using up all the bandwidth during your time range, and you can trace it back to the specific user of the device:

Auvik TrafficInsights: Top talkers view
To see why the user is taking up so much bandwidth, you can navigate to the Applications breakdown and determine if they’re backing up files while away from their desk or if they’re streaming Netflix while they eat their lunch.
Case #3: The client says certain countries are off-limits
Some of your clients may be in highly regulated industries where they’re not allowed to communicate with certain countries. But how can you know when data is passing through a destination it’s not supposed to be in?
With TrafficInsights, it’s as easy as looking on a map. The Geolocation area in TrafficInsights shows you the distribution of traffic by geographic location:
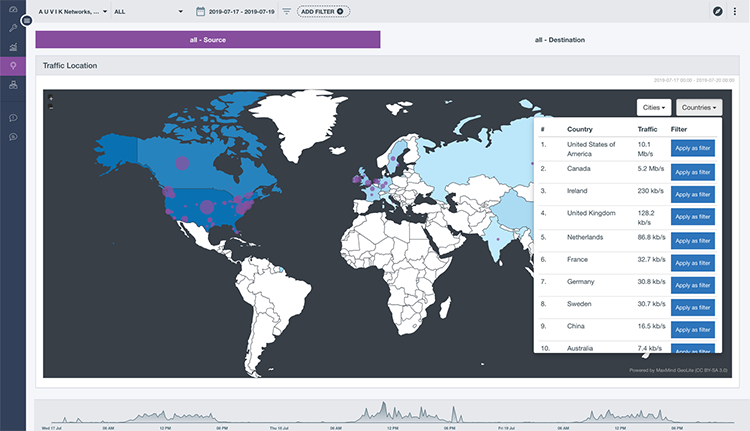
Auvik TrafficInsights: Network traffic by source and destination geography
In this view, you can see the source and destination IP addresses of all your client’s network traffic. This allows you to easily spot traffic bound for sanctioned countries your client has no business dealings in, identify which device is sending the traffic, and isolate the device the traffic is coming from.
And if you determine the traffic is illegitimate, potentially malicious, or headed to a sanctioned country, then you can take action and add restrictions to stop it in its tracks.
And just like that, you’ve quickly gotten to the bottom of three common cases—and you look like the Sherlock Holmes of network management.
Ready to see more of TrafficInsights? Download the Keeping Client Networks Healthy & Secure With Auvik TrafficInsights ebook for a closer look at the dashboard—and two bonus use cases.
The post How to Solve Network Cases Like a Super Sleuth With Auvik TrafficInsights™ appeared first on Auvik Networks.