Despite everyone’s best efforts, network failures happen. And when downtime means lost productivity, fast troubleshooting becomes an integral part of IT operations. So with the addition of OID (object identifier) monitoring history, Auvik providing users an archive for troubleshooting, analysis, and planning.
When it comes to managing network issues, diagnosing the root cause is the first step. And often, there’s a gap between when an incident occurs, and when it’s reported.
And herein lies a big problem: if you don’t know the state of a faulty device(s) at the time trouble begins, you aren’t likely to produce a permanent fix.
Knowing the historical metrics of a device’s components is critical. Because without the data, IT has to spend time both reproducing the incident and then capturing values in real-time. Having that information already on hand, through the ability to access and store historical OID monitor results, greatly reduces diagnosis times, and helps drill down to the root cause of an issue.
What is an OID (and an MIB)?
Simple Network Management Protocol (SNMP) is one of the basic ways networked devices share information with one another. SNMP doesn’t exchange data in a rigid format of fixed size, but uses a tree-like format consisting of multiple tables, called Management Information Bases, or MIBs (and not “Men in Black”). Each SNMP MIB has a unique identifying number, as well as an identifying string.
MIBs consist of one or more nodes (objects), representing individual devices or components of devices on the network. Each of those nodes has a gets a unique identification.
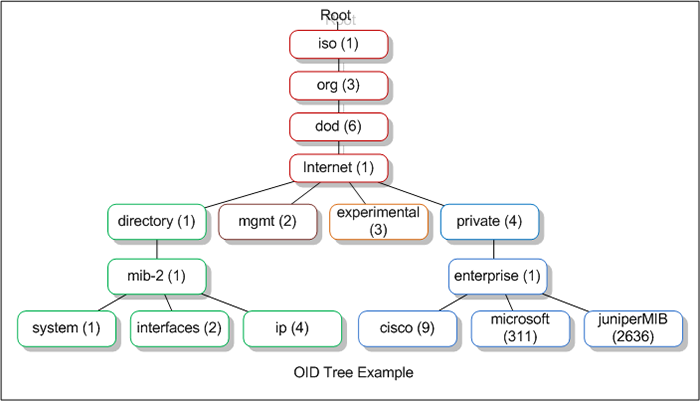
Source: Wikipedia
In short, an SNMP Object Identifier, aka an OID, is the way the SNMP protocol tracks and shares unique attributes about various components in network devices. Each OID contains information about a particular aspect of a device—like fan speed or CPU temps—which can be very helpful when troubleshooting a network or studying the network topography.
What are the benefits of using OID monitor history?
When it comes to network optimization, monitoring and management software like Auvik is constantly polling your devices to give you real-time, deep visibility into the state of your network. With OID monitor history data, you can use that slate of polling metrics to not only troubleshoot transient issues faster but prevent them from happening again.
Some examples include:
- Troubleshooting call failures by looking at a history of data such as the number of simultaneous call connections, SIP status, and number of SIP registrations
- Tracking incidents a high memory utilization
- Pinpointing file storage incidents with a history of used disk space and overall disk status
OID monitor histories can also be used to observe trends, such as capacity usage, or to estimate disk life. Using historical trends, you can now confidently plan for future capacity and infrastructure needs going forward.
Viewing and storing your OID monitor history in Auvik
Thanks to our users*, Auvik has added the ability to store and view the history of OID monitors from your network devices. Auvik now collects and shows the historical values for OID monitors in the two ways:
1. Numeric OID monitors
A time-series graph is shown for numeric OID monitors, such as device temperature. To set the unit display name in the graph, you can edit the existing monitor setting to specify the units.

2. String OID monitors
Historical values of a string OID monitor can be displayed as a changelog for values, such as last diagnostic date, or as a table of values for metrics such as status.


How to view custom OIDs in Auvik
By default, Auvik will gather a number of SNMP OIDs from your devices. But if you’re not seeing what you need, you can always add your own custom OIDs. To add your own, just follow these steps:
- Click Discovery in the side navigation bar.
- Click the Discovery Settings tab.
- Click Monitor Settings.
- Click Add Monitor Setting.
- Fill in the Add Monitor Setting form.
- Name: Specify the display name for the monitor.
- Devices: Select the devices that you want to apply the monitor to. Be as specific as possible, so that the devices that recognize the OID are being queried. See How to filter data in Auvik for more detail.
- Type: Select the type of the value. Either a String or a Numeric type is supported.
- Use As (String type only): If you select the type of String, select how you want the OID to be used. From the Use As dropdown, select either Monitor Only (for alerting) or Serial Number (no alerting).
- Poll Period: Select how often you want Auvik to query the device for this monitor.
- Units (Numeric type only): Specify the label for units in the time-series graph.
- Click Save.
For more information on how to add, edit, or delete OID monitors, see our Knowledge Base.
How to view historical OID monitor data in Auvik
- Access the complete list of custom OIDs for your site by selecting Debug in the side navigation bar.
- Select All OID Monitors.
- Click on the OID monitor row to see the historical view.
- Use the option at the top right to select the date range.
If you’re looking for the list of custom OIDs set up for a specific device, click on the Debug tab from the device dashboard, and from the drop-down menu, click OID Monitors.
The addition of monitoring history for SNMP OIDs was one of the most highly-voted suggestions from the Auvik Idea Portal. Many companies build idea portals or feedback pages for customers, but Auvik actually listens. Each one of our users’ suggestions for features or fixes that receives votes is reviewed and discussed by our developers. We’ve already been able to roll out several highly requested improvements, with more on the way. If you’re an Auvik user, make sure to drop in and vote!
And if you aren’t yet an Auvik user, now is the time to try. Take our 14-day, risk-free trial of Auvik now.
The post Introducing OID Monitor History appeared first on Auvik Networks Inc..